Ravn in action
A working tour of the Operator Console — the live portal over the control plane — driven by real Kubernetes and host signals, explained in plain language by a small local model (CPU, or a GPU when you have one), with supervised self-healing.
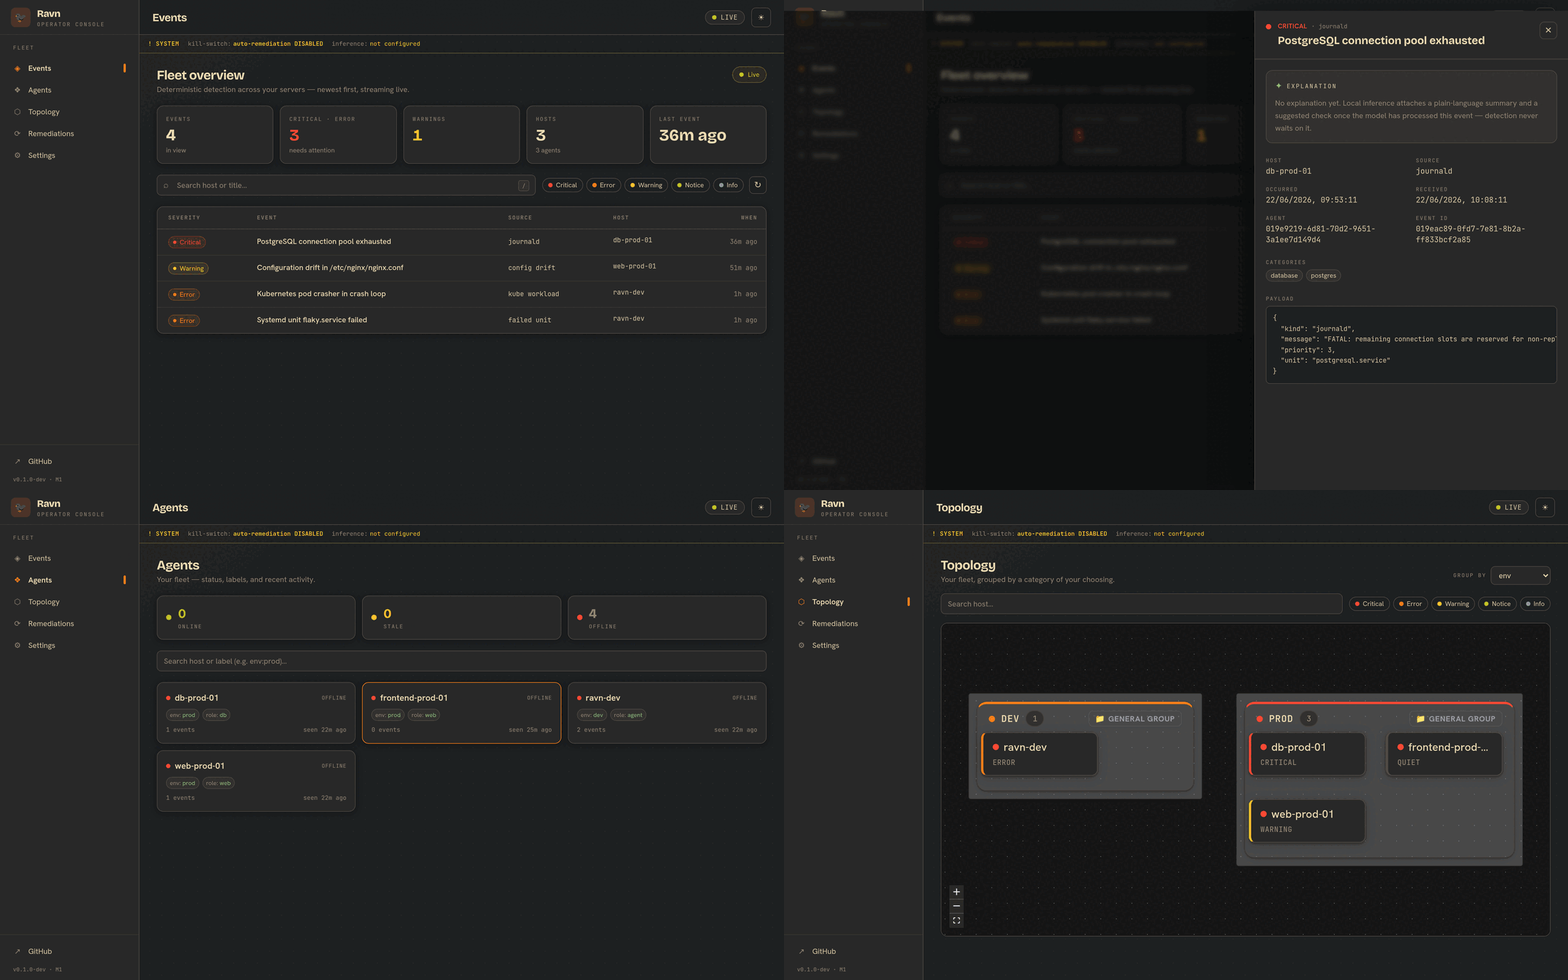
A walkthrough of the live portal: the fleet event feed, an event opened to its AI explanation, the fleet inventory, the grouped topology view, and the self-healing remediations.
A real-life scenario
3:41am. The
paymentsservice in the prod-eu cluster starts getting killed under load.
Here’s what happens, end to end — and crucially, no language model is anywhere near the decision that something is wrong.
-
Detection (deterministic). The Ravn controller — a single read-only Deployment, no sidecars — is watching the cluster’s Events API. The kubelet OOM-kills
payments/api-7d9f8; anOOMKilledevent fires. The controller maps the reason to a severity with a fixed table (OOMKilled → Critical) and emits a structuredKubeWorkloadevent. This path is pure code: it would fire identically with the model switched off. -
Transport + persistence. The event crosses to the control plane (authenticated — the agent presents its projected ServiceAccount token, validated against the cluster’s OIDC JWKS), lands in Postgres, and is fanned out to every connected portal over a WebSocket. The alarm is already ringing.
-
The last mile (the model). Off the detection path, the control plane asks a shared inference endpoint to explain the event. The reply is attached to the stored event when it returns — and if the model is slow or down, the event simply keeps its deterministic title. Safe failure.
The operator opens the event and sees this:
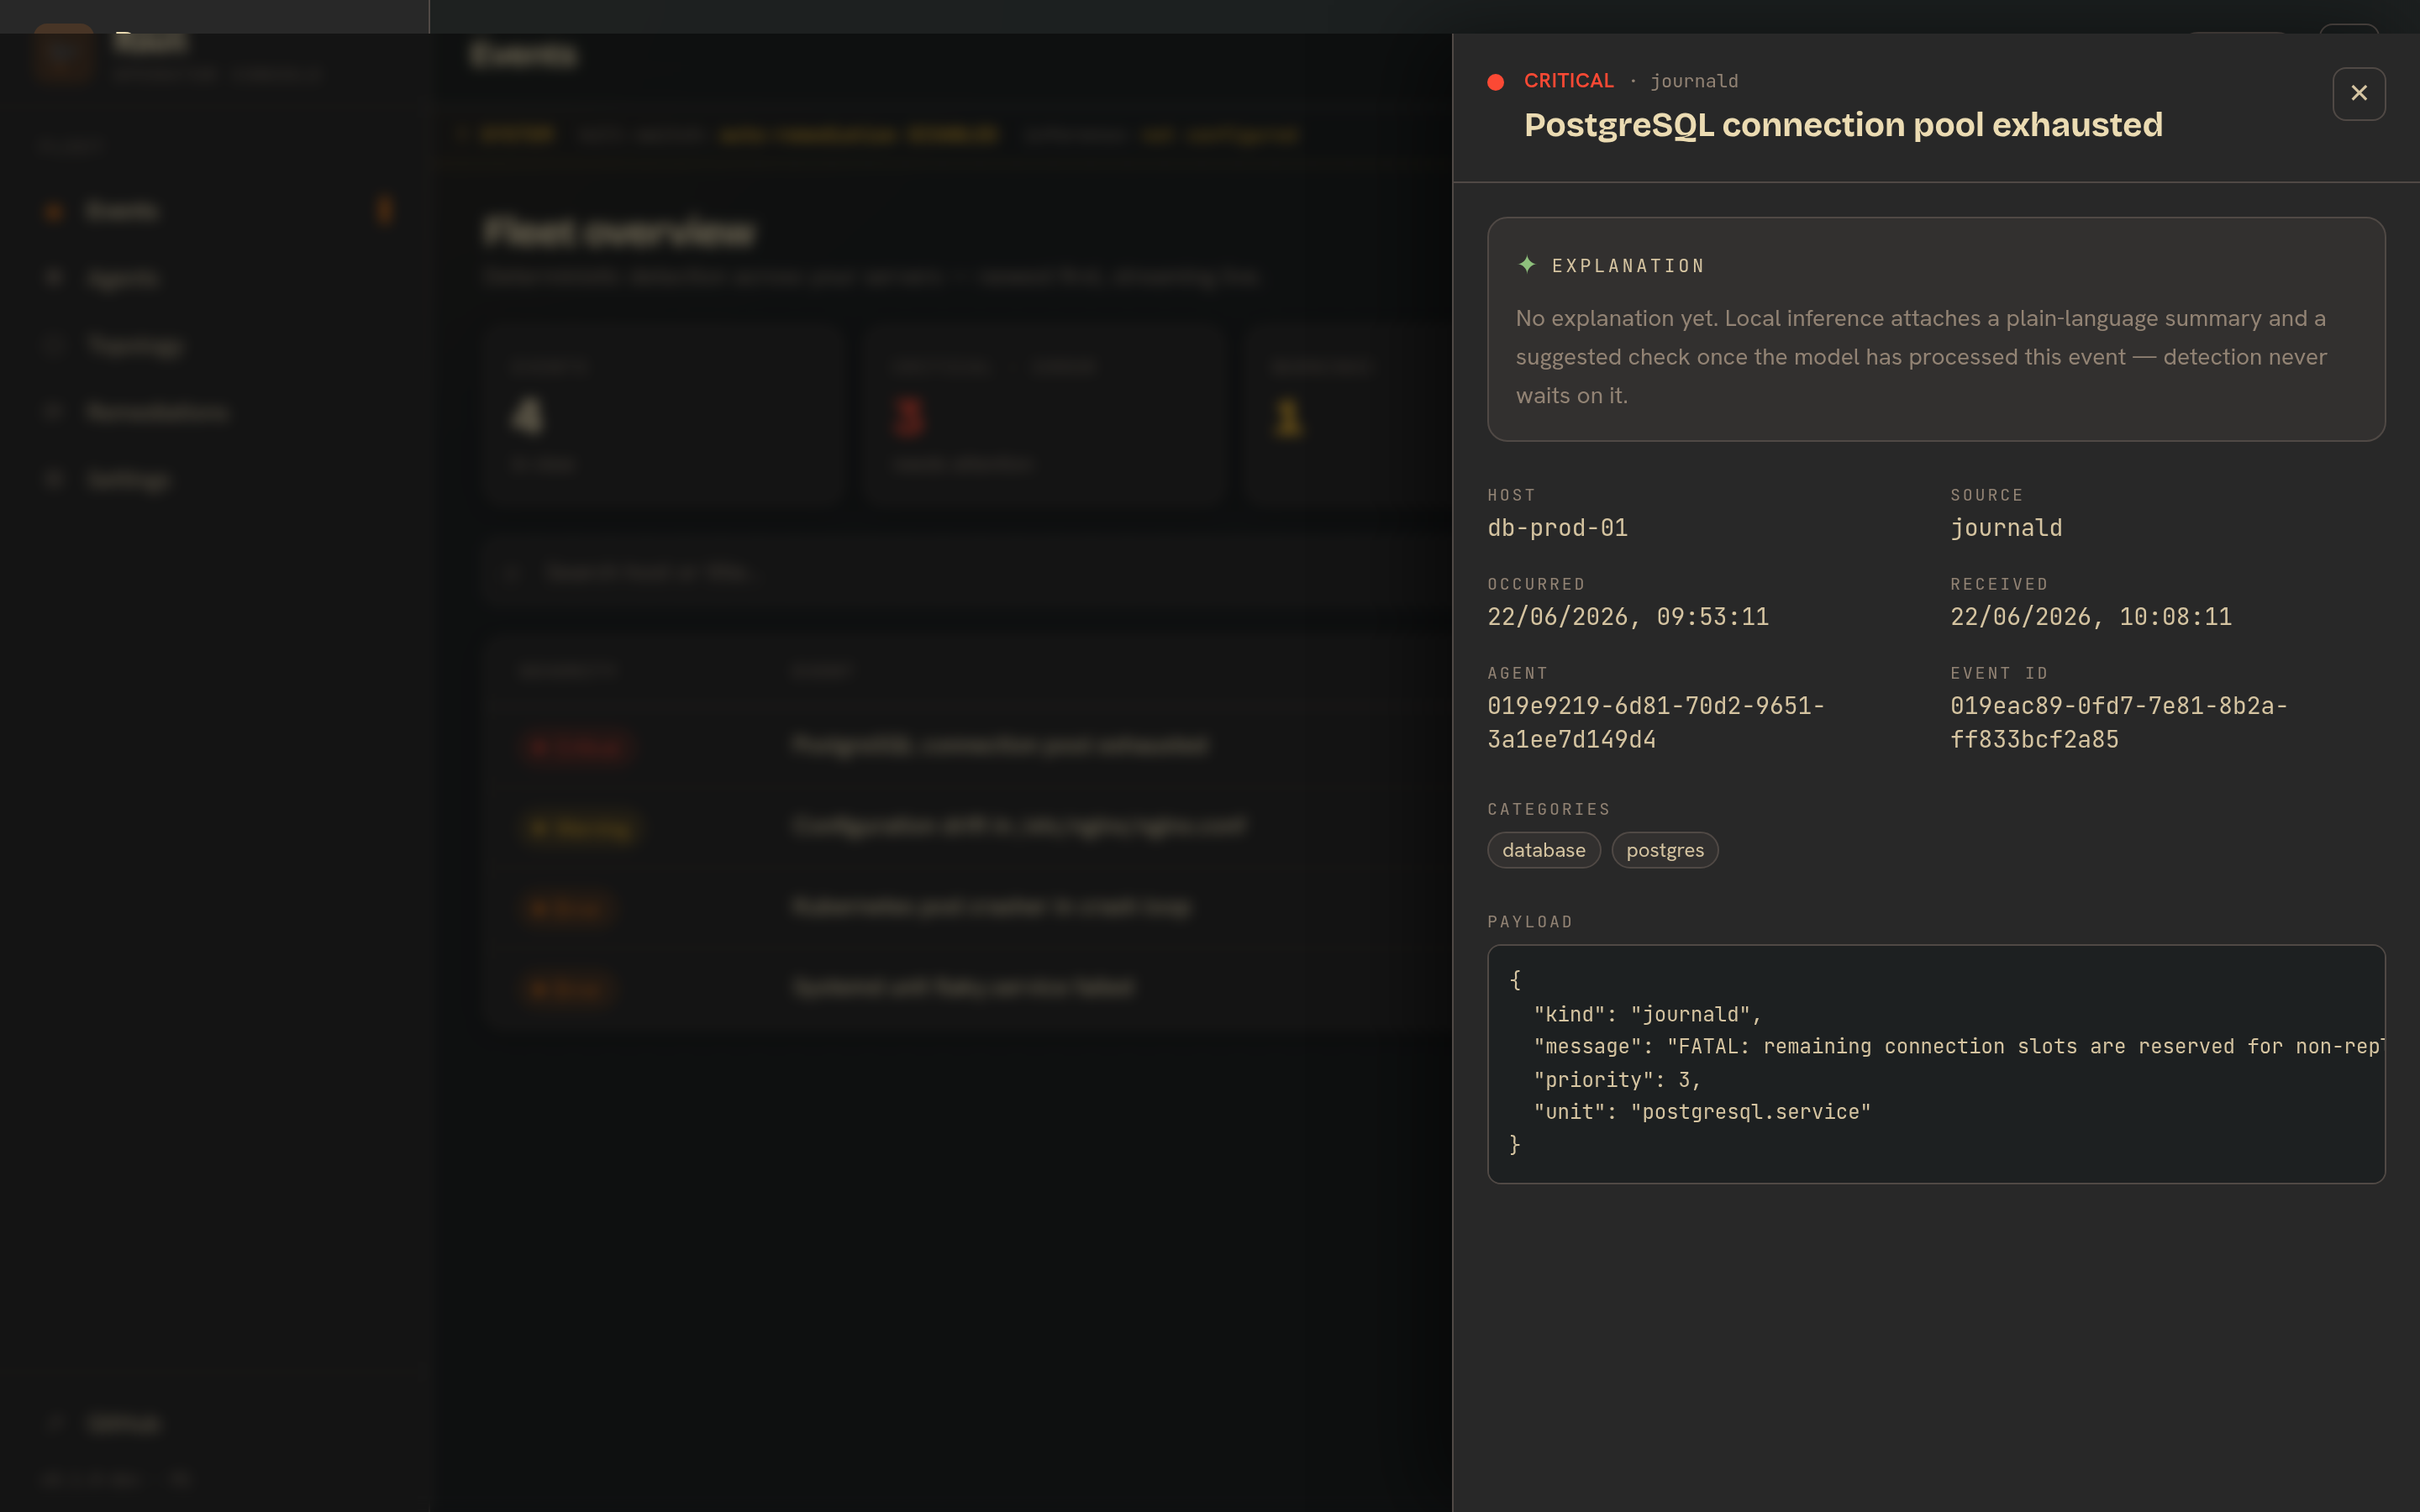
The pod’s container exceeded its memory limit (512Mi) and was terminated by the OS to prevent further resource contention. This indicates a potential misconfiguration or uncontrolled memory usage in the container.
Suggested check:
kubectl top pod payments· via qwen3:1.7b
Deterministic detection on the left; a plain-language explanation and a concrete next command on the right — produced by the same small model (Qwen3 1.7B) the host agents run locally under llama.cpp, so host and cluster signals read alike.
The fleet, at a glance
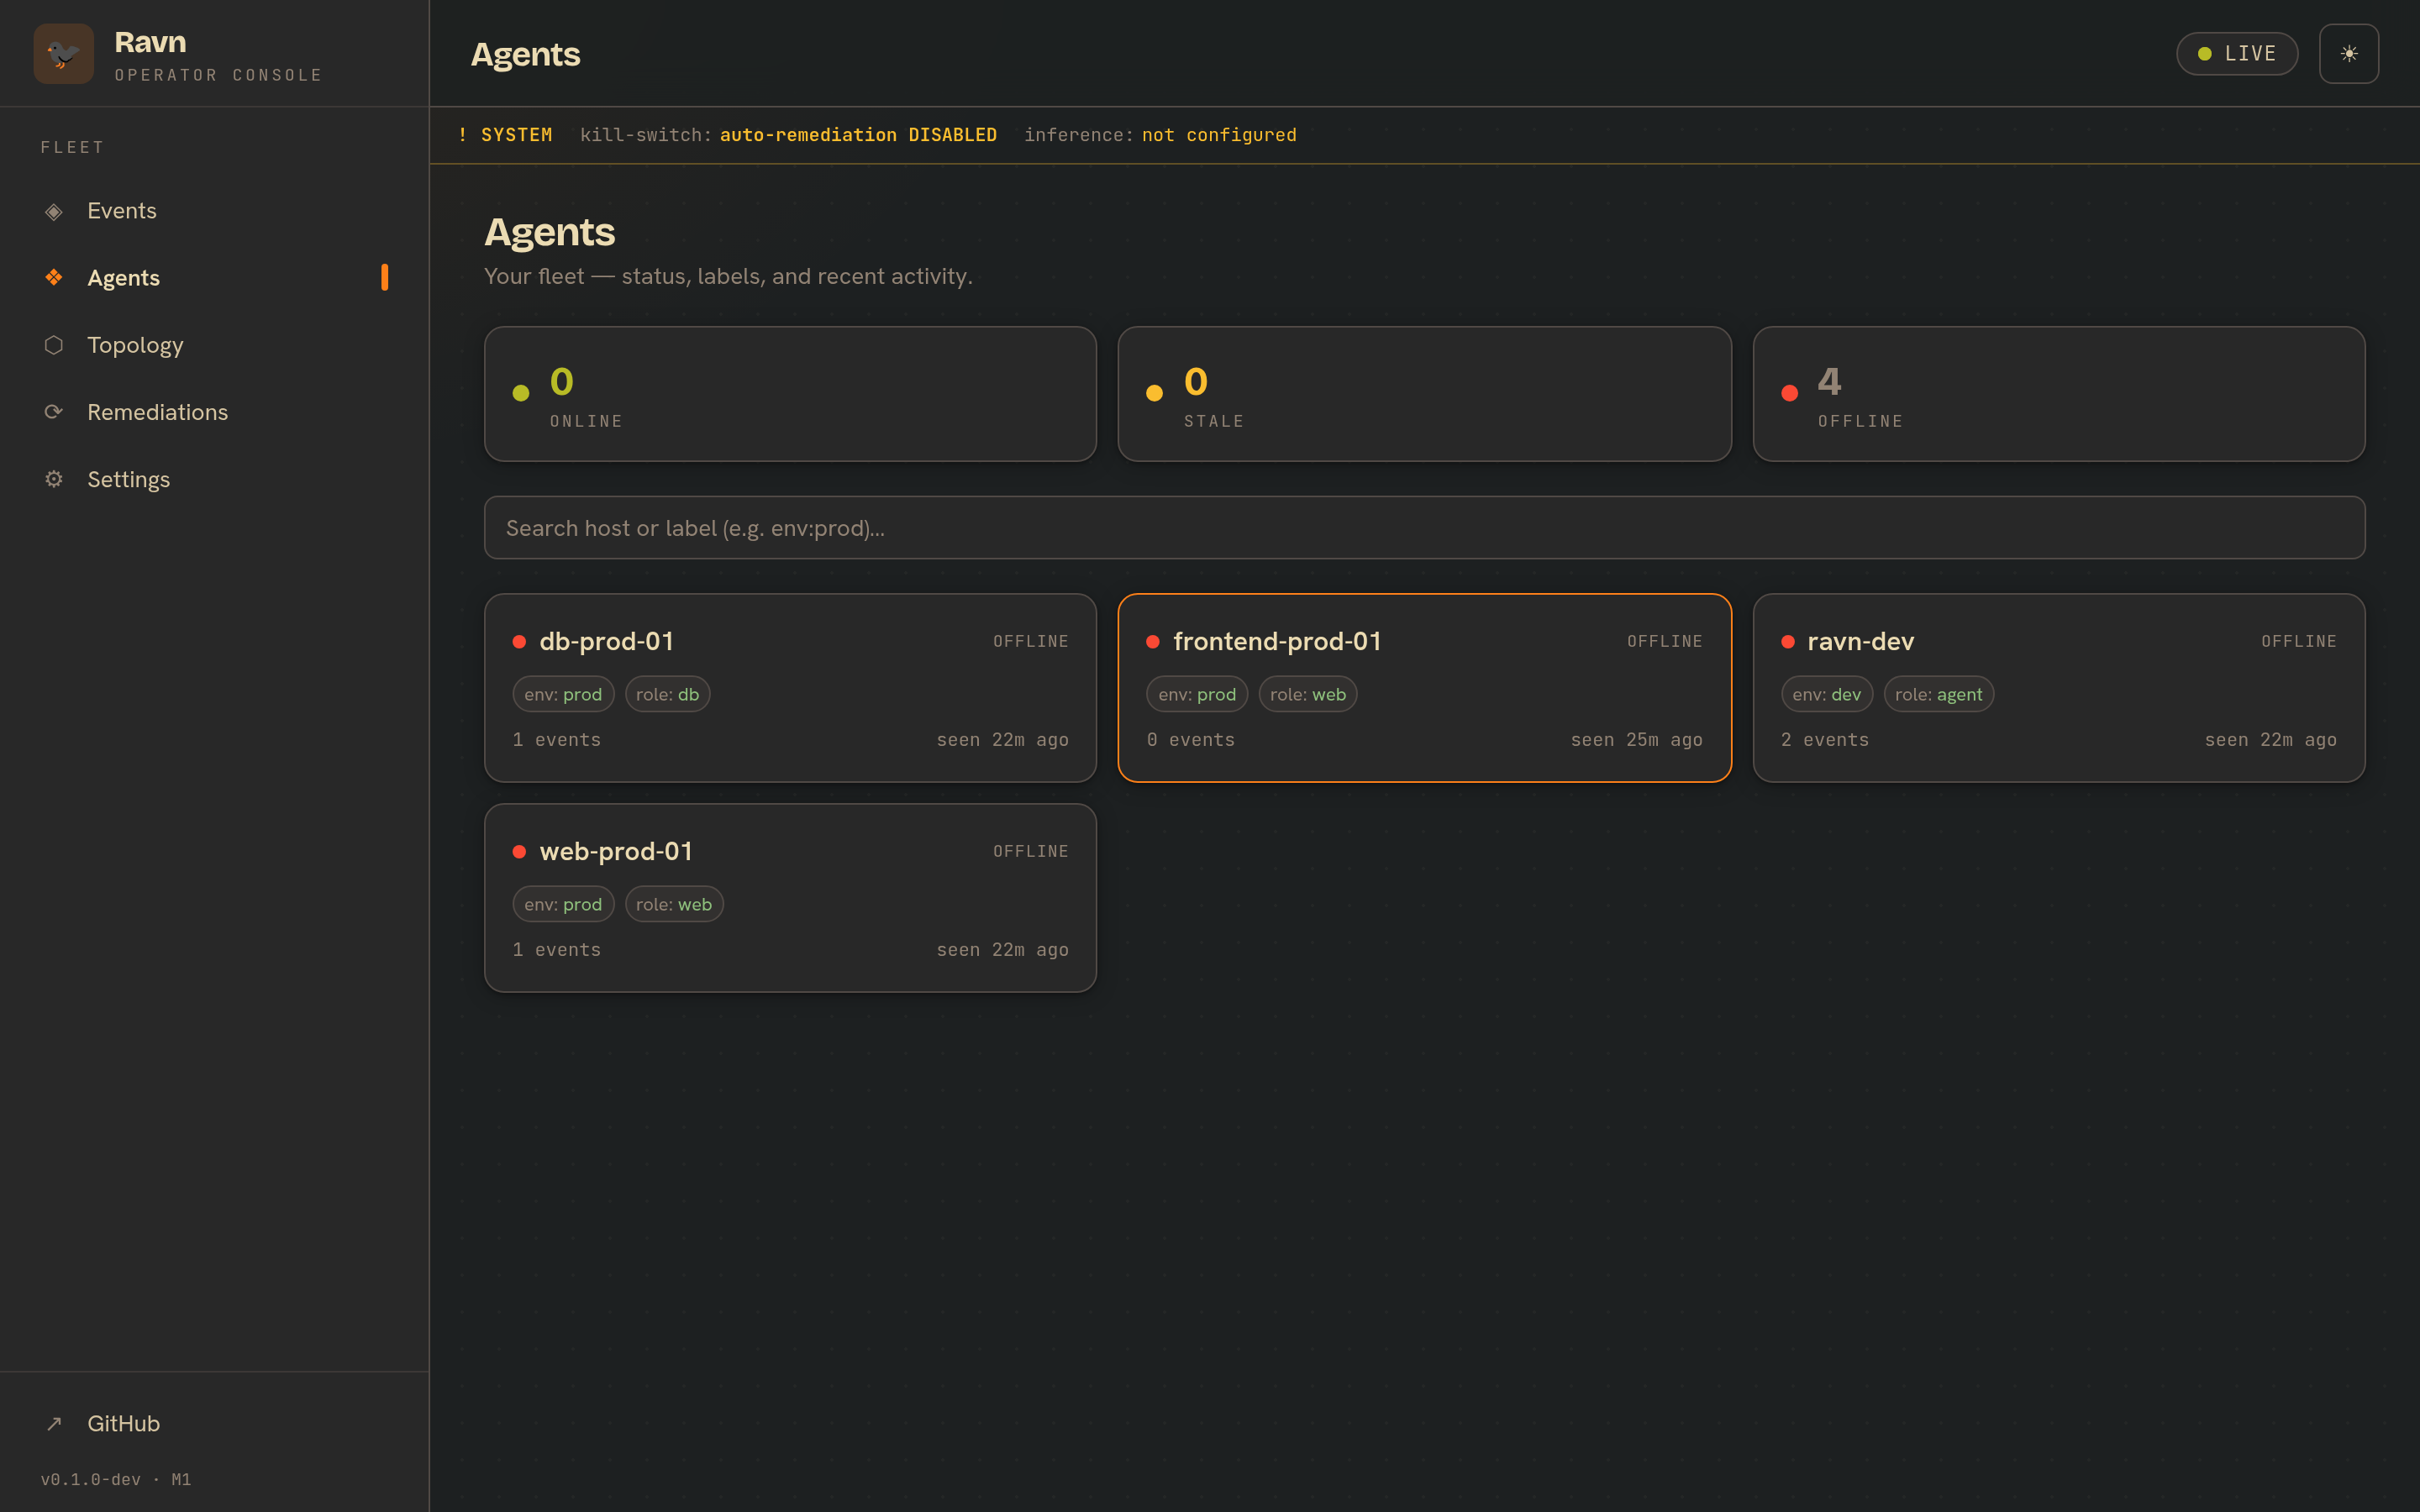
Every host and cluster that reports in becomes a card with a live status and a
worst-severity rollup. Here three clusters — prod-eu, prod-us, staging —
sit alongside the local dev cluster.
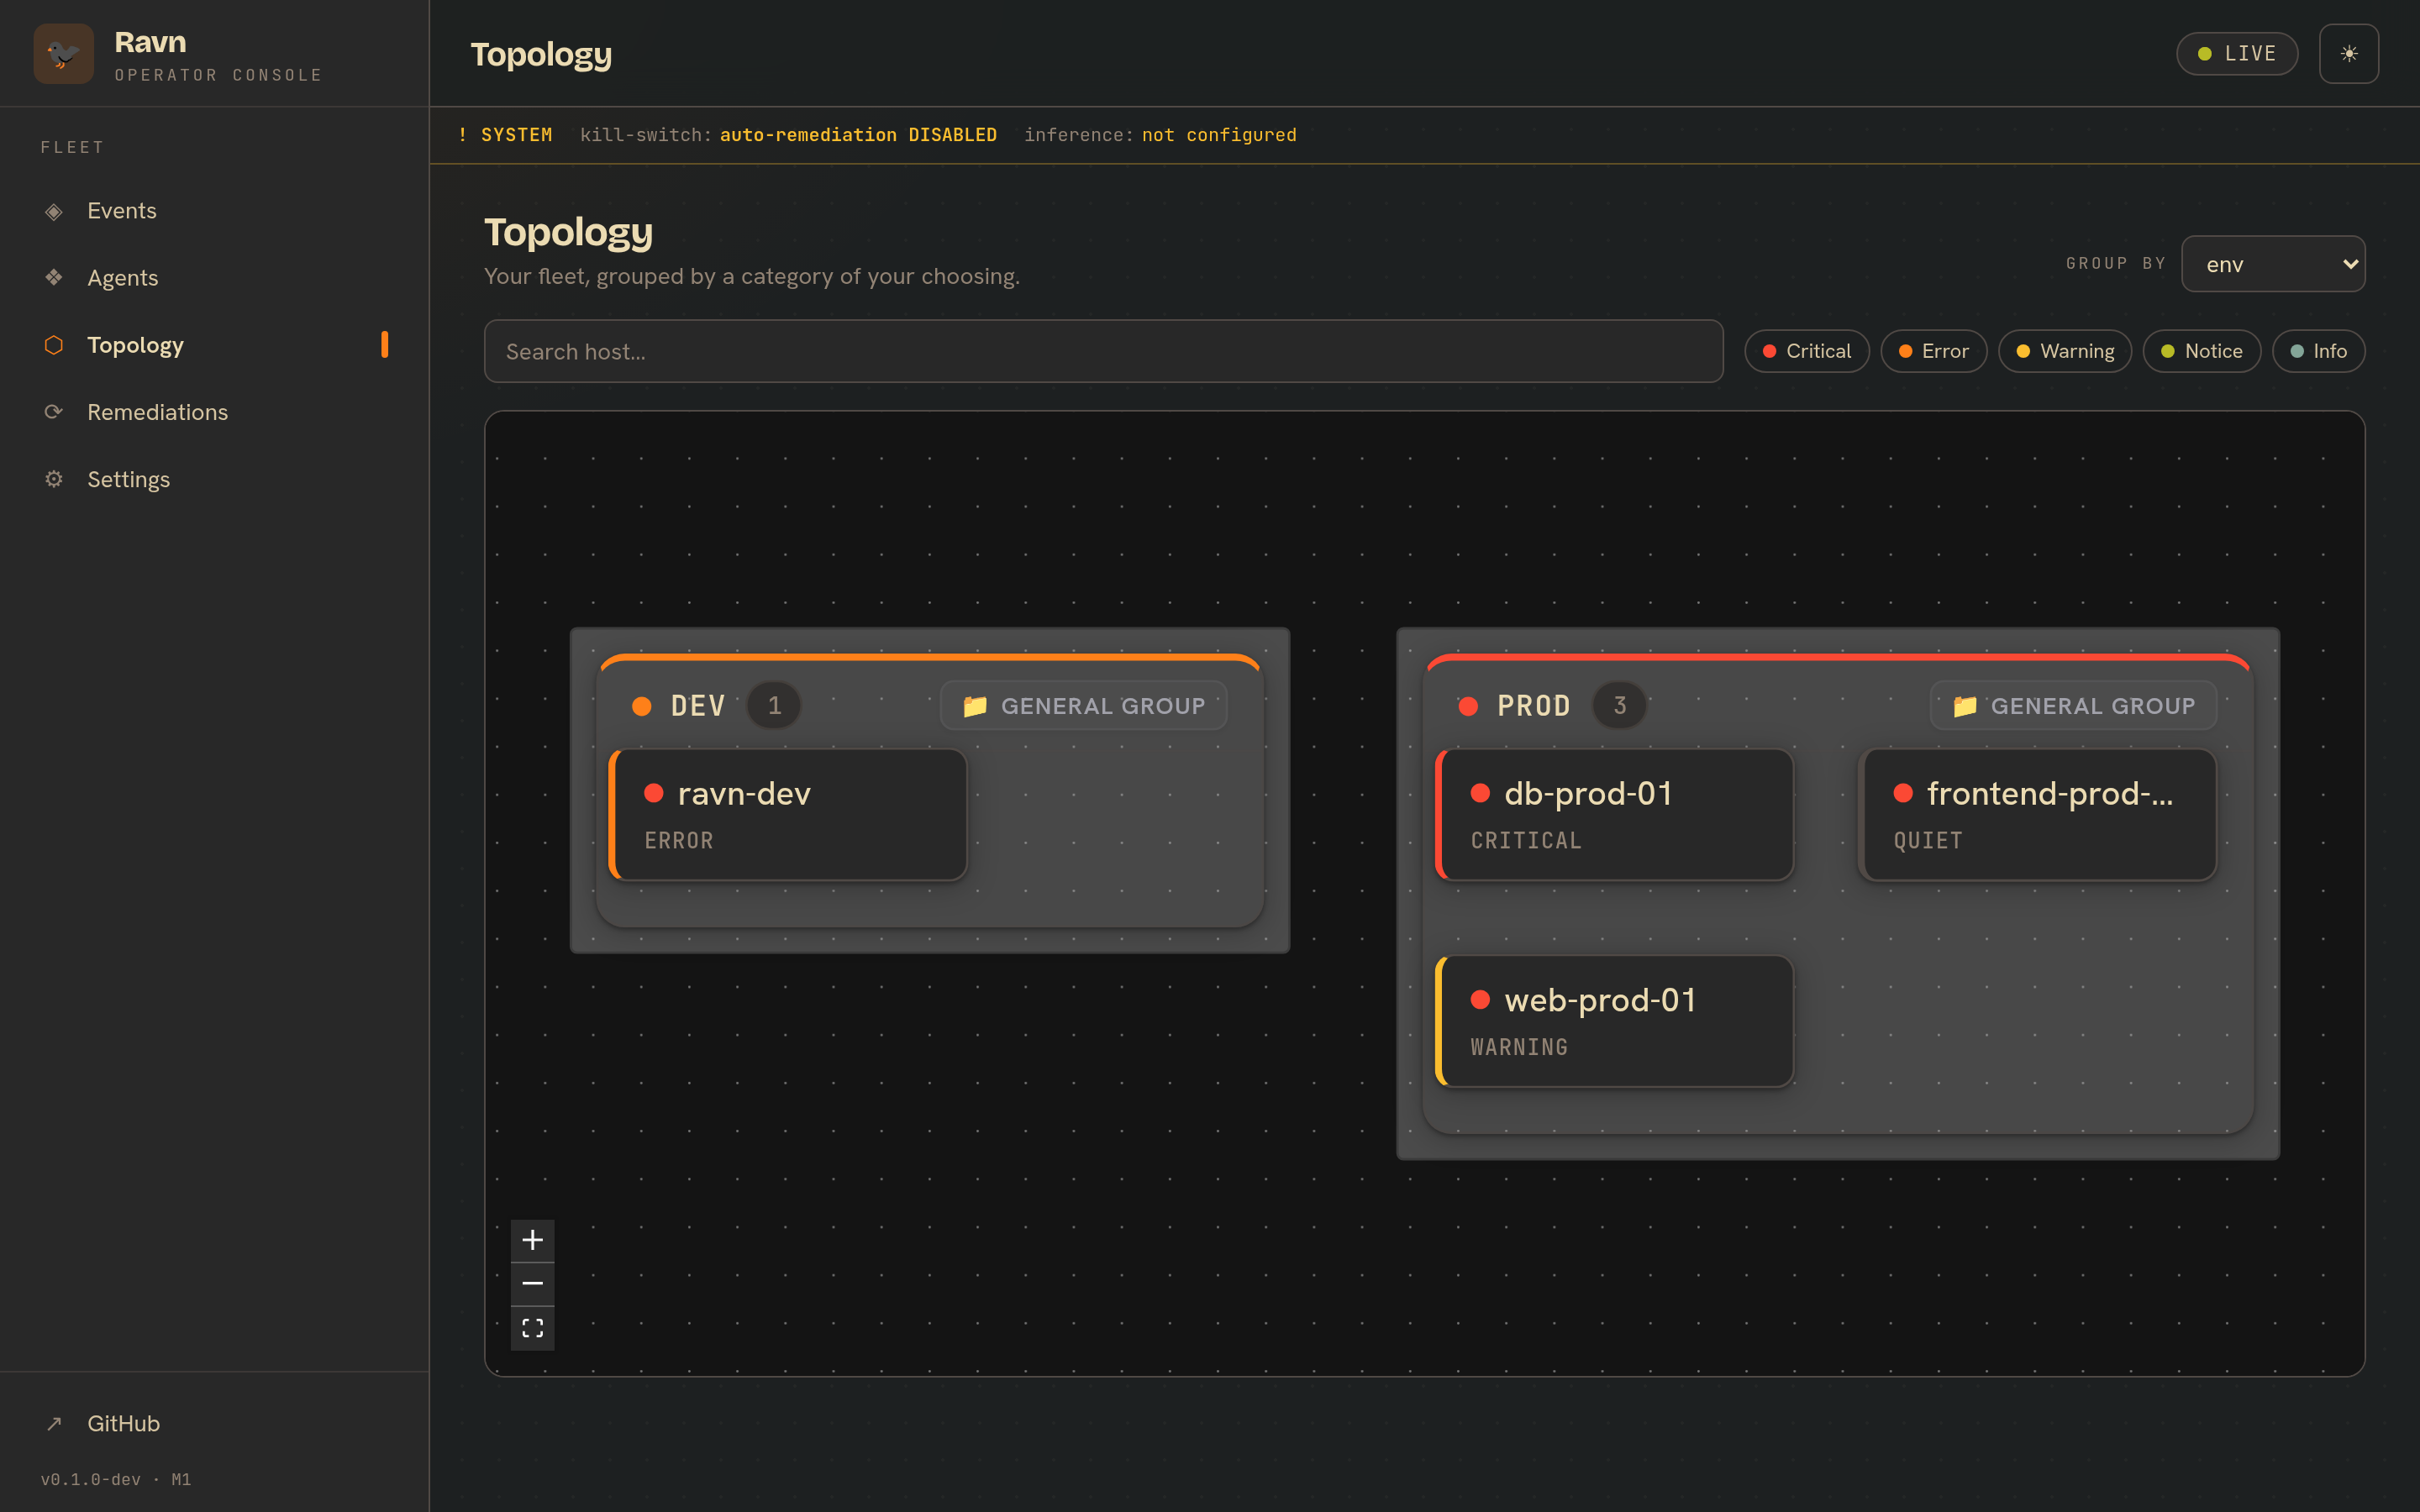
The topology view groups the same fleet by a category of your choosing (environment, region, team — whatever labels you attach), colour-coded by the most severe live event per node, with a per-kind icon so different things read differently. Here the one-box demo groups into a ☸ k3d cluster (failing pods, red) and a ❄ NixOS host (healthy, green):
It heals itself — with your approval
Detection closes the loop. When a deterministic fault matches a curated template, the control plane proposes a fix; you approve it; the control plane signs an Ed25519 command; the agent’s privileged actuator runs exactly that typed action and reports back — recorded at-most-once. The model is never in this path either.
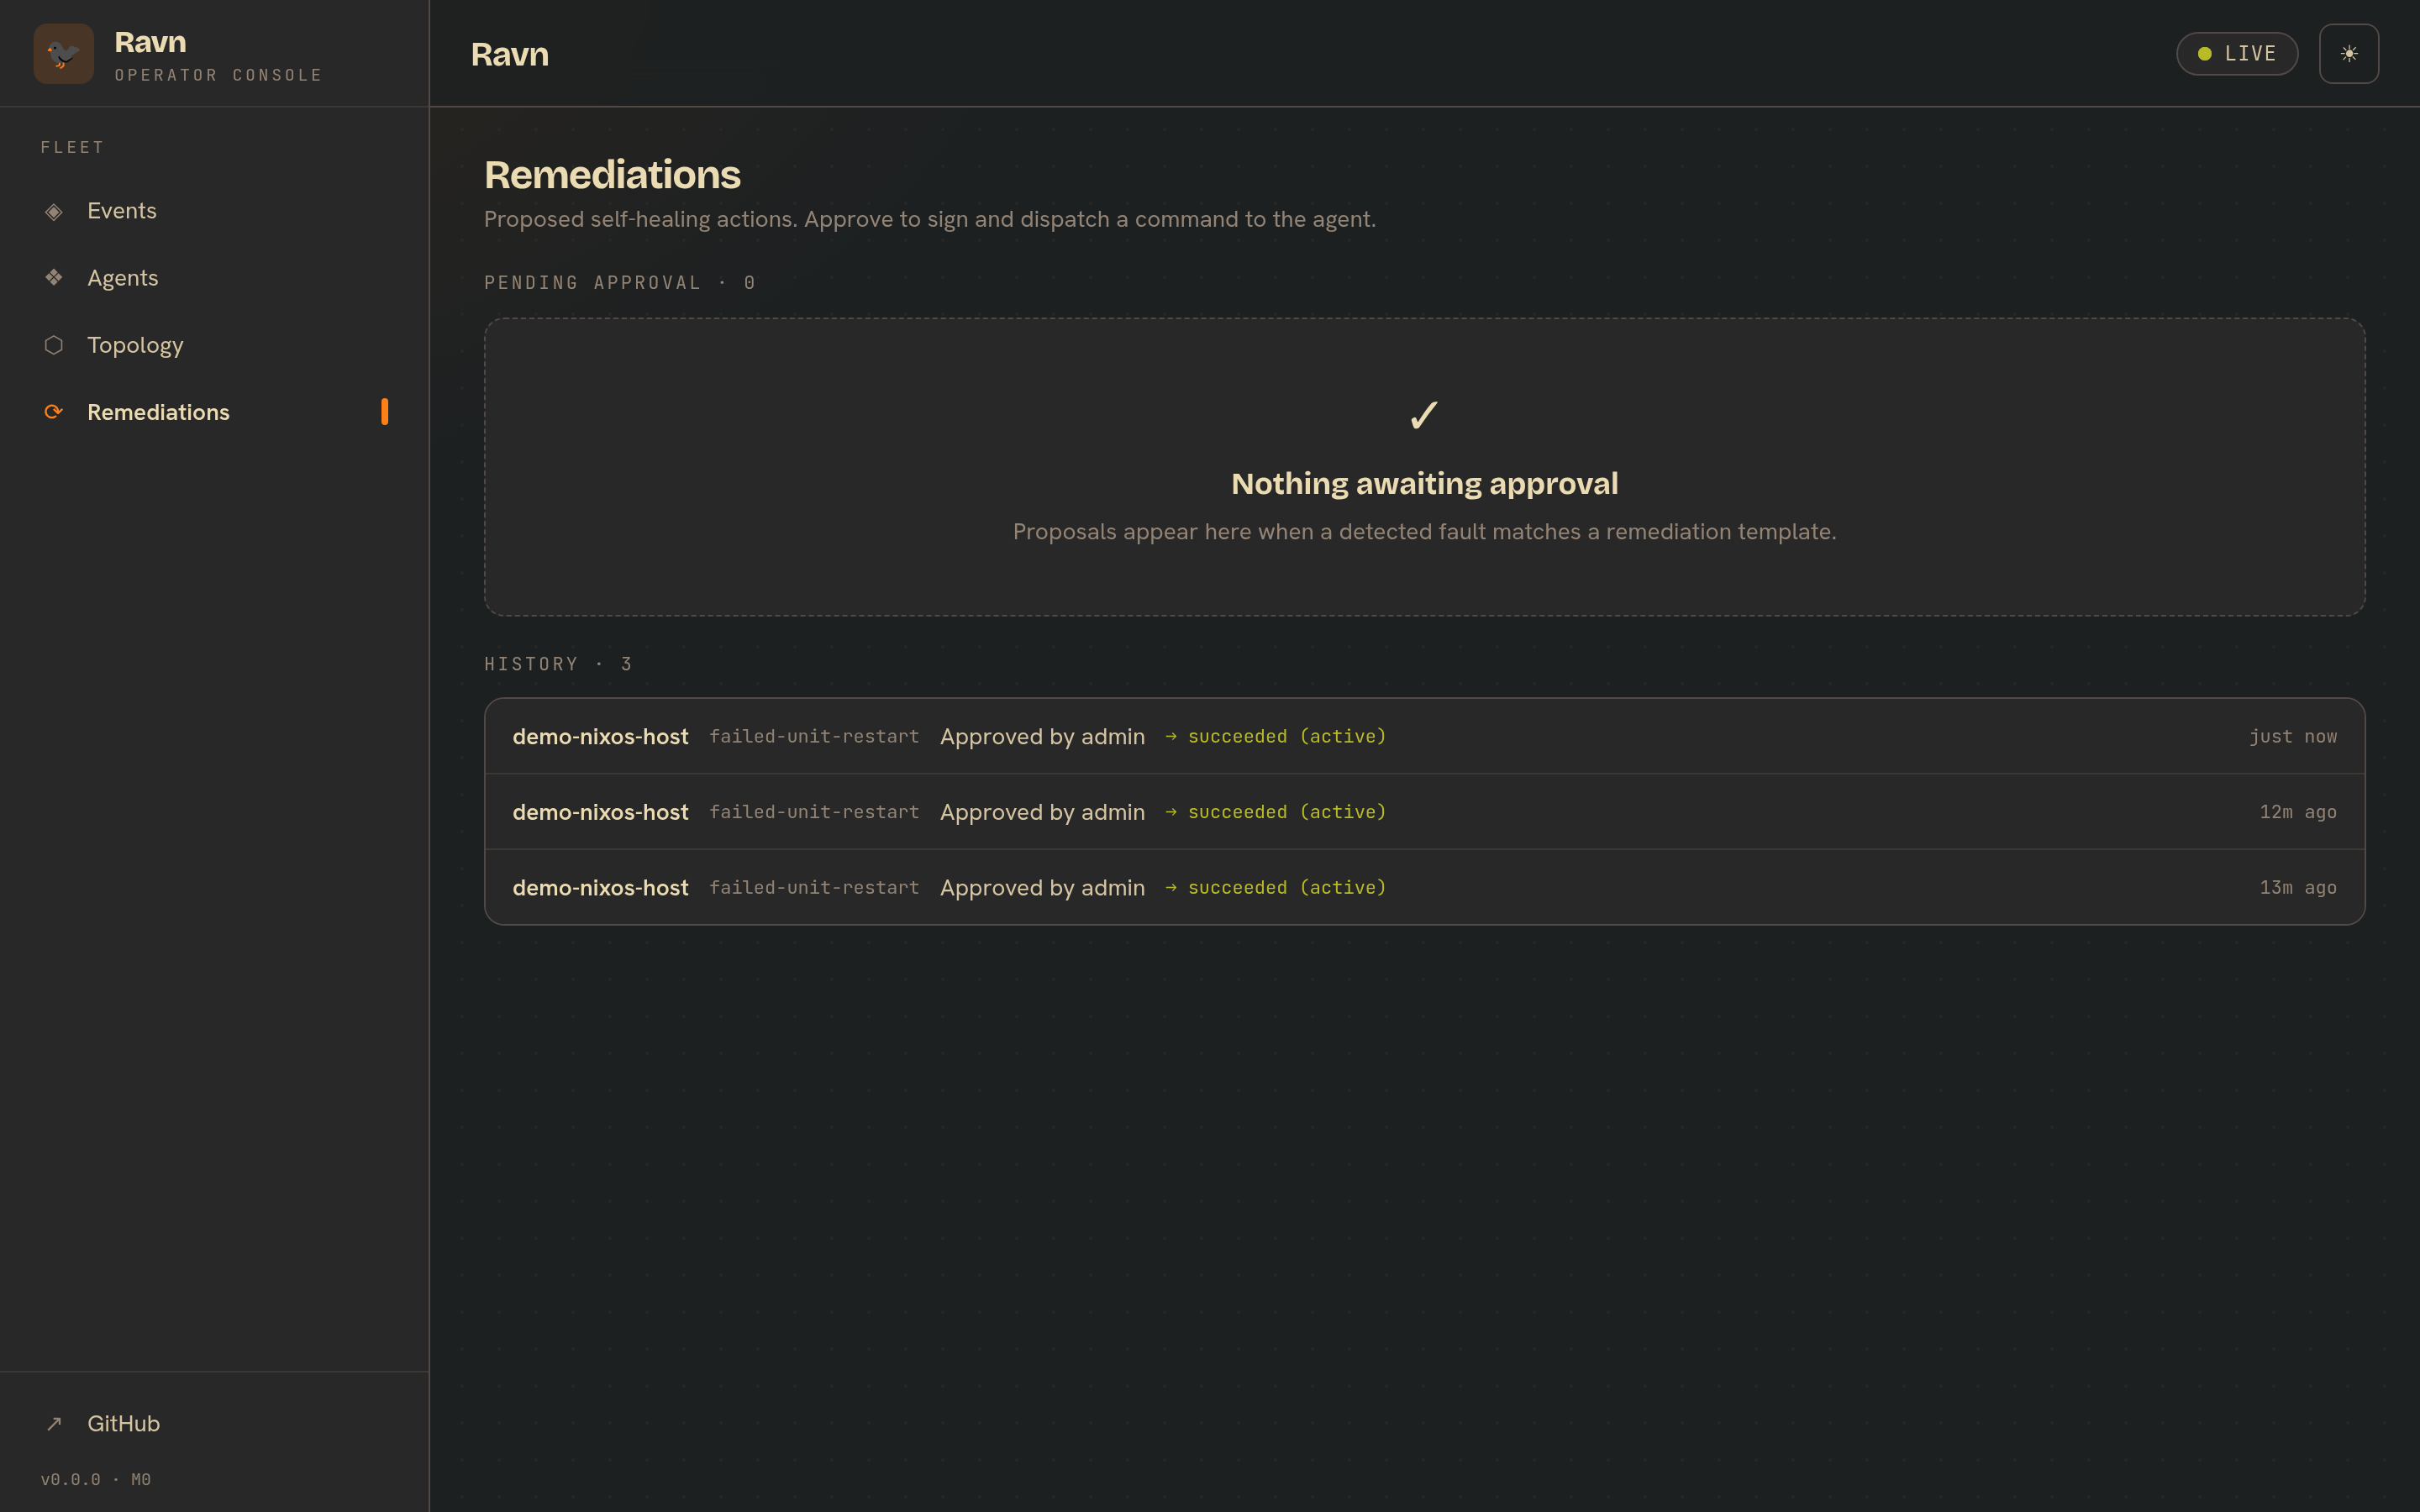
Kill a flaky.service on the demo host and watch it go
proposed → approved → succeeded (active) in a few seconds — or let an
auto-approve policy handle the low-risk ones. A default-deny gate, a circuit
breaker, and a kill switch keep it safe.
How it’s built
Ravn is a three-plane system that shares one Rust type system end to end, so an event the agent emits is the exact shape the server persists and the portal renders.
| Plane | What it is | Stack |
|---|---|---|
| Edge | ravnd host agent (+ a privileged actuator) and the Kubernetes controller & node-agent |
Rust, deterministic taps, kube-rs informers, an OpenAI-compatible model (llama.cpp / Ollama, CPU or GPU) for the local last mile |
| Control plane | ravn-server — ingest, persist, explain, propose + sign fixes, serve |
Rust (axum), NATS, Postgres (partitioned time-series), OpenAI-compatible inference client, Ed25519 command signing, Prometheus metrics |
| Portal | the Operator Console | React + React Flow, typed against the server’s OpenAPI |
The guiding rule: the LLM is never in the detection hot path. Deterministic tooling decides whether something is wrong and fires the alarm; the model only writes the explanation. A slow or wrong model degrades the wording, never the alerting.
See the Architecture page for the full design.
More real-life scenarios
The OOMKill above is the cluster path. Here are everyday host ones — each is a TOML template you can copy from the template library, not code you write. Every action is deterministic, signed, and audited; the model only ever explains.
nginx falls over (safe, can auto-heal). A worker segfaults and
nginx.serviceentersfailed. Thenginx-restarttemplate (safetier) proposes areset-failed+restart, confirms the unit is really failed first, and verifies it’sactiveagain within 30s. On a host where you’ve optedsafe-tier remediations into auto, this heals in seconds with a signed record; otherwise it waits one click. But if nginx was only blipping and systemd’s ownRestart=already brought it back, the tap’s grace period means Ravn never proposed anything — no noise.
Postgres dies (guarded, always manual).
postgresql.servicefails under load. Thepostgresql-restarttemplate isguarded— a database restart is service-affecting, so it never auto-executes, even wheresafe-tier auto is on. The operator gets a proposal with the failure explained and a 120s verify window (Postgres is slow to finish crash recovery); they approve, and the heal is recorded. Risk tiers are how you keep one service manual while others heal themselves.
A config that should never change, drifts (dangerous, manual). Someone edits
/etc/nixos/configuration.nixoutside the deploy pipeline. The config-drift tap fires; thecritical-config-drift-rollbacktemplate (dangeroustier) proposes a NixOS generation rollback — and waits, becausedangerousnever auto-runs. A human decides whether that drift was intended.
“Is it broken, or just deploying?” A planned systemctl restart never enters
failed; a rolling update or scale-down produces Kubernetes lifecycle reasons, not
failure reasons; and every template re-checks state at execution time, so anything
that recovered between detect and act heals nothing. Ravn infers intent from state,
not from guesses.
What’s shipped so far
- Agent — host detection taps (journald, failed units, config drift, auth, updates), local CPU-only inference with reactive + periodic-digest modes, resource caps, a NATS/WebSocket transport, and an offline buffer.
- Control plane — axum API + OpenAPI, NATS ingestion → Postgres, agent registry + category model, Prometheus metrics, and auth: agent credentials (mTLS enrollment + ServiceAccount-token ingest) and portal user OIDC + RBAC.
- Kubernetes — a workload controller, a node DaemonSet agent, OIDC / TokenReview ingest auth, control-plane inference for K8s events, deploy manifests + a Helm chart + OCI images, and a kind/k3d end-to-end test.
- Supervised self-healing (Linux/NixOS hosts) — a PARR loop (Prepare/Act/Reflect/Review): deterministic template matching (the LLM never decides), Ed25519-signed commands, a privileged actuator under privilege separation, an at-most-once ledger, a default-deny policy + circuit breaker, verify/rollback, and a retrospective knowledge base. The in-cluster K8s executor has landed (#146) and the audit trail is now durable in Postgres (#143) — both pending final end-to-end verification (k3d / live Postgres) before release. Signing-key rotation, a copy-paste template library, and a failed-unit grace period (suppresses brief blips) round it out.
- One-box demo — a NixOS host, a k3d cluster, and GPU-accelerated local
explanations (AMD ROCm / NVIDIA / CPU), with a live
kill → propose → approve →
heal
loop —scripts/demo-up.sh. - Observability & eval — a model benchmark harness, prompt-regression fixtures, metrics, security hardening, and an end-to-end smoke test.
- Portal — live event feed, fleet inventory, a grouped topology view (with per-kind icons), and the Remediations approve/heal page.
Everything above is verified end to end — including a real k3d cluster whose
crashing pod’s BackOff events flow through the controller, the control plane, and
into Postgres, and a host unit that is killed, proposed, approved, and healed live.
Browse the work, organised by epic with good first issue labels, on
GitHub, and follow the
devlog for decisions and struggles.