We’ve talked a lot about what Ravn is — small local-LLM agents that watch Linux/NixOS hosts and Kubernetes, report in plain language, and heal things with your approval. This post is about being able to see all of it at once, on one laptop, with a single command:
scripts/demo-up.sh
That brings up a systemd “NixOS host” (running the agent + the privileged
actuator + a deliberately flaky unit), a k3d cluster (the Ravn controller plus a
node-agent and a spread of healthy and failing pods), a self-contained Ollama for
the explanations, and the portal — all on one shared network. Then
scripts/demo-remediate.sh --auto fails a unit and heals it end to end while you
watch.
It works now. Getting there surfaced a string of small, honest problems that are worth writing down — they’re the useful part.
Seeing the fleet
The topology view now groups the fleet by any label you like and draws an icon per kind of thing, so a Kubernetes cluster and a bare host read as two different animals at a glance:
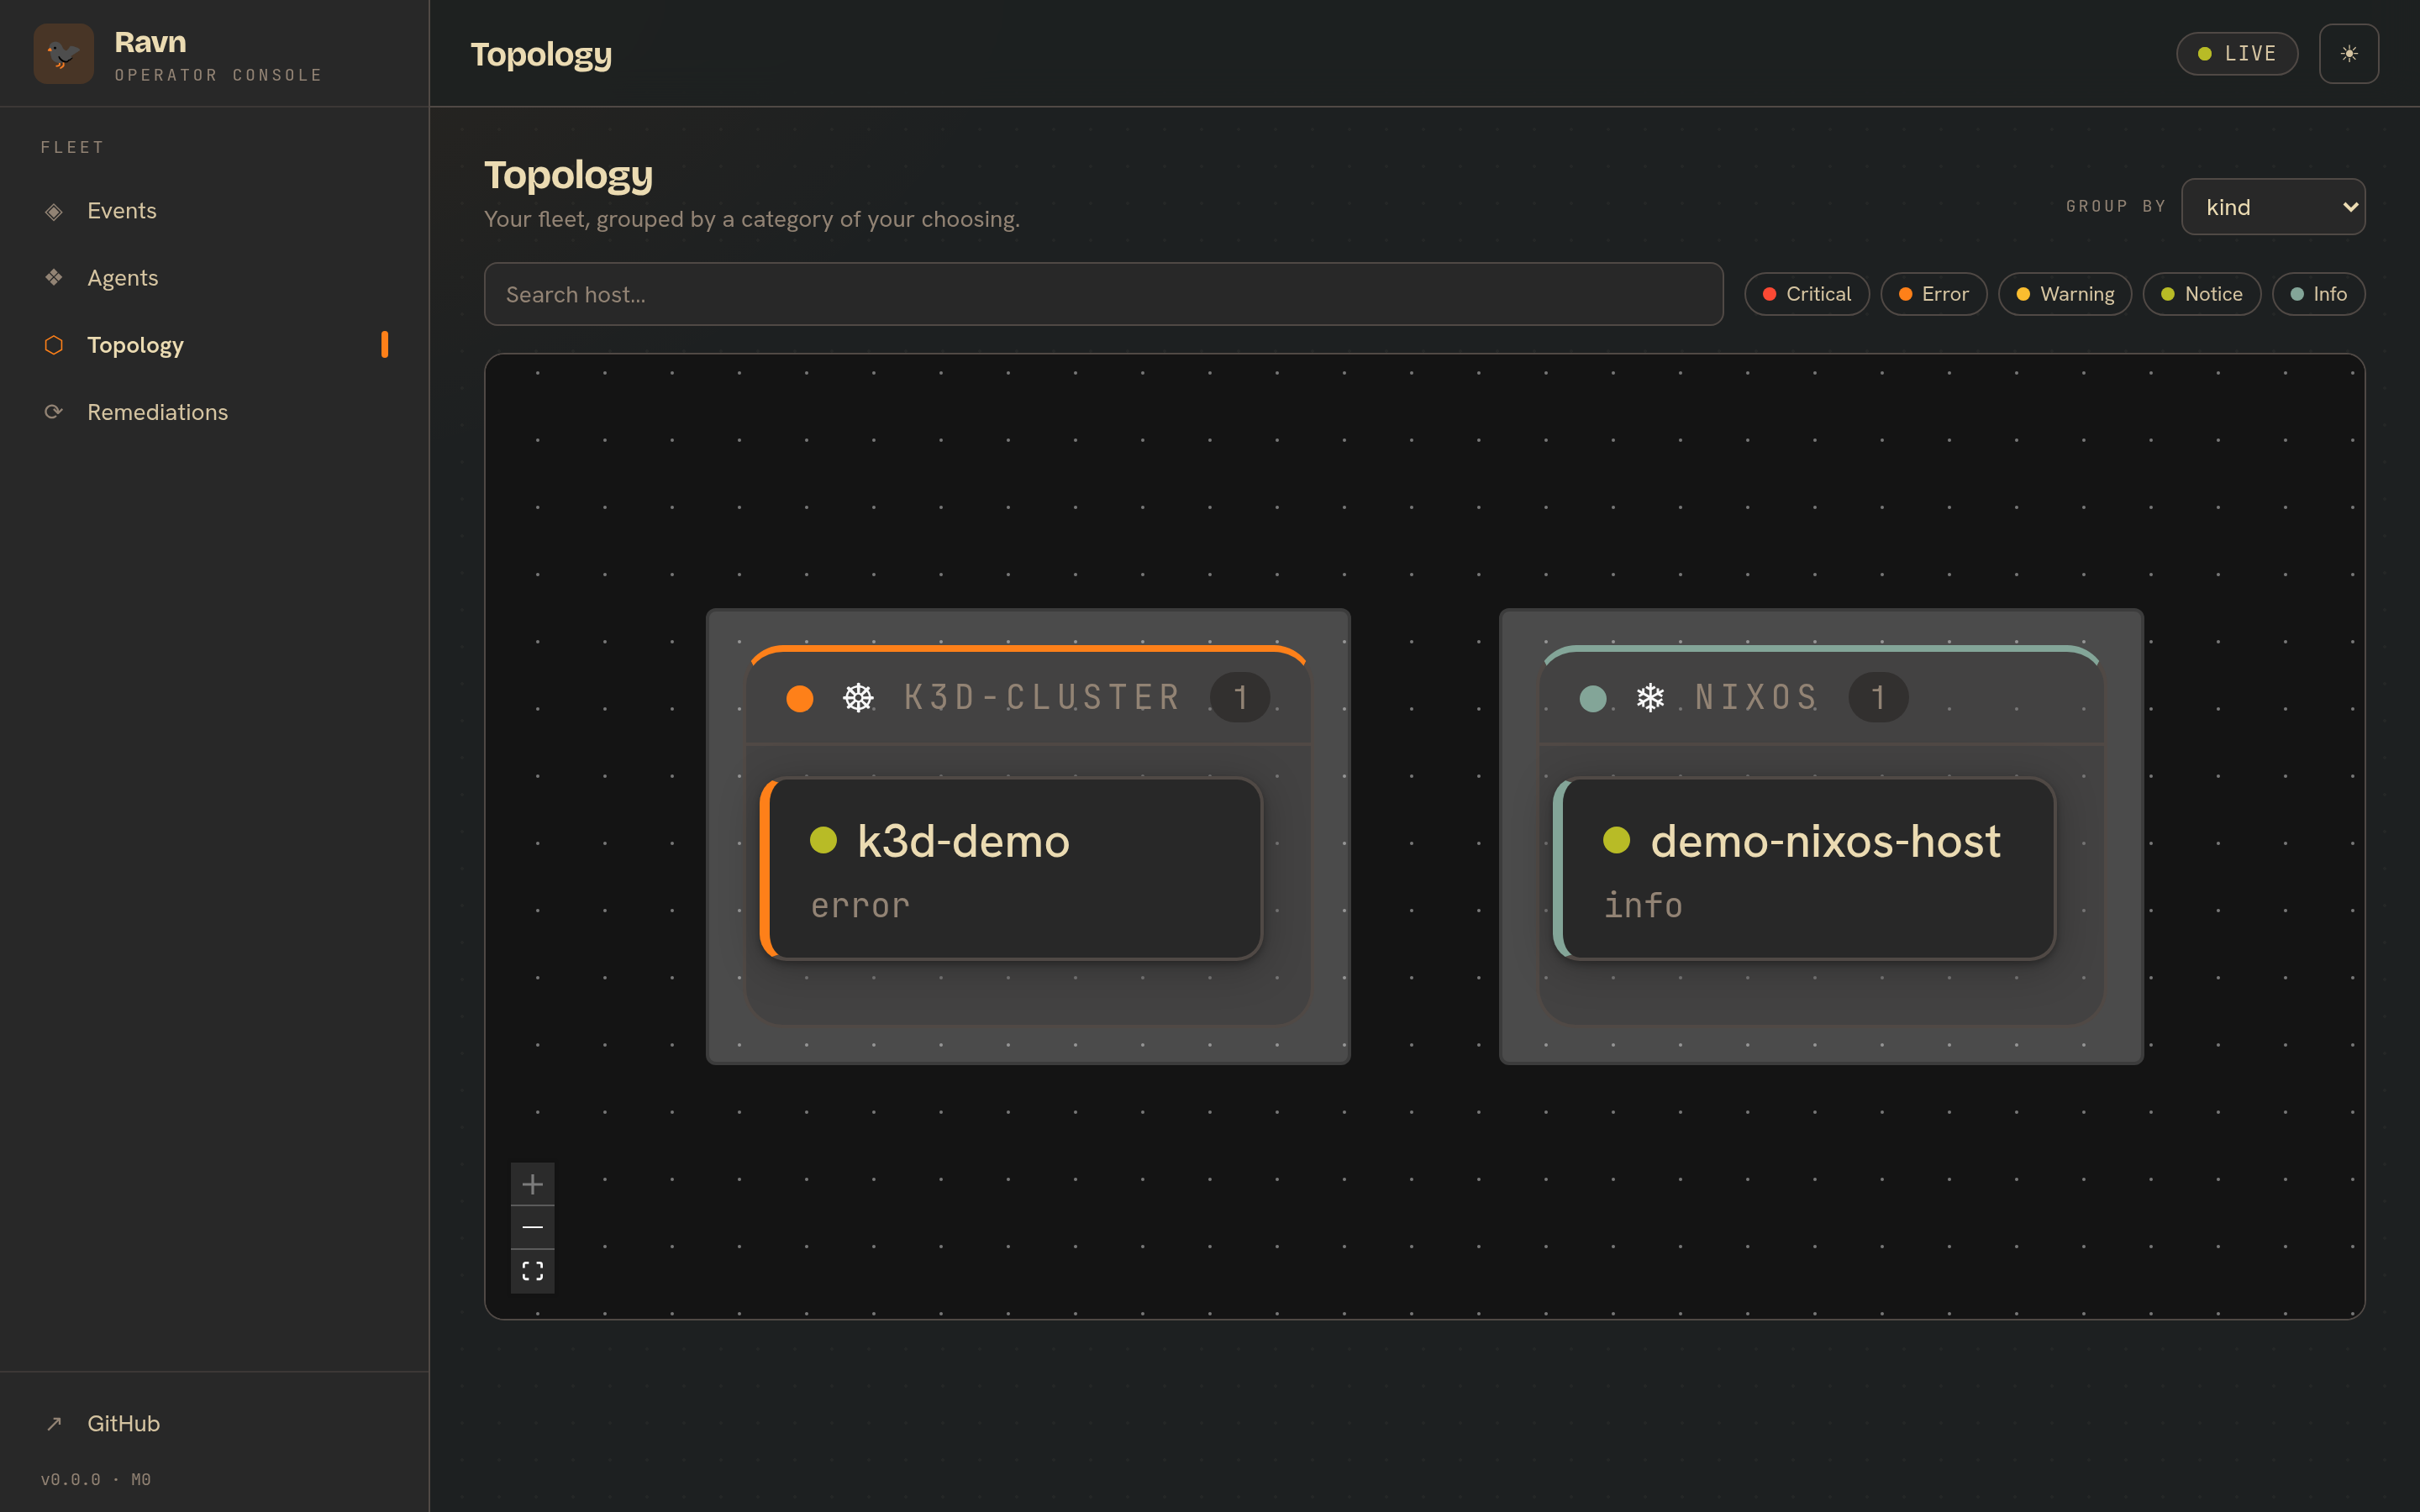
That’s the ☸ k3d-cluster group (the controller agent, currently red because its pods are crashlooping) next to the ❄ nixos group (the host, green and healthy after its last heal). The portal auto-selects the most useful grouping dimension on load, so you land on this instead of one undifferentiated blob.
The last mile: plain-language translations
Deterministic tooling decides whether something is wrong — failed-unit state, CrashLoopBackOff, OOMKilled, ImagePullBackOff. The model’s only job is the last mile: turning that flagged event into a sentence you can act on. Two paths feed it, both pointed at the same local Ollama:
- Host events (failed units, journald) are explained by the agent, inline, before the event is even published.
- Kubernetes events are explained by the control plane, asynchronously, so ingestion never waits on the model.
Click any event and you get the translation plus one concrete check to run:
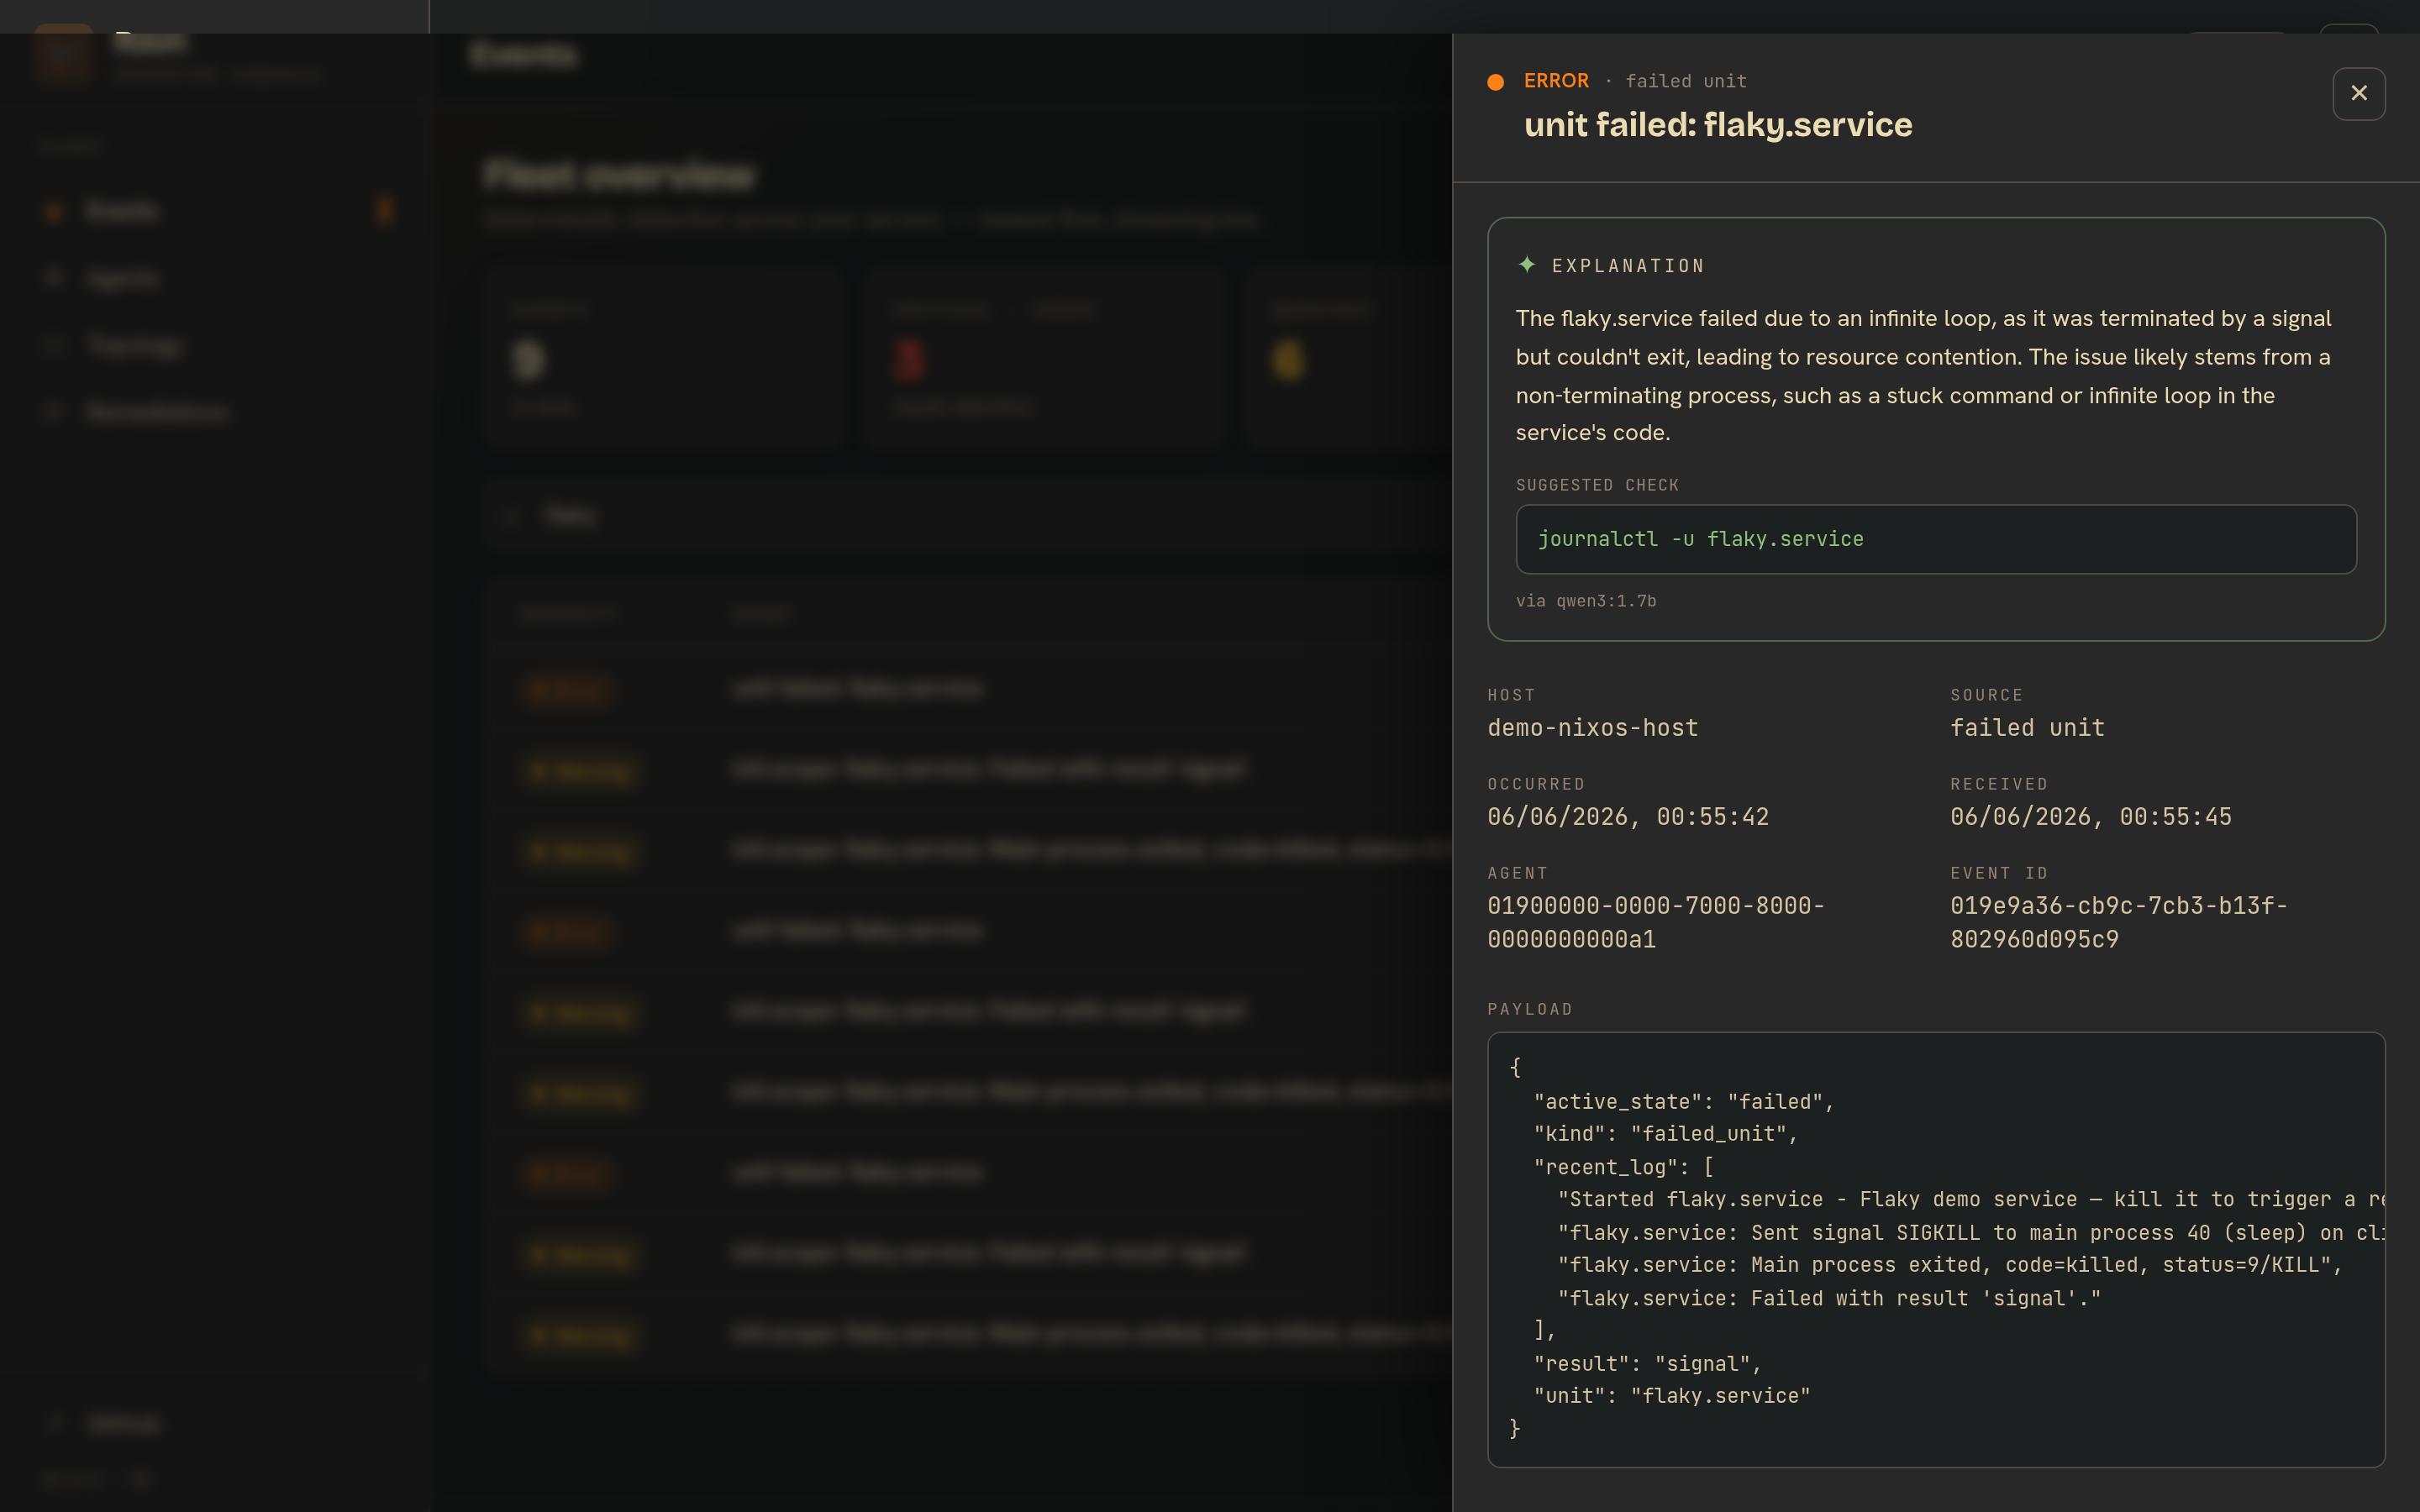
“The flaky.service failed due to an infinite loop, as it was terminated by a signal but didn’t exit, leading to resource contention…” — with a suggested
journalctl -u flaky.service, generated locally by Qwen3 1.7B.
If the model is slow or down, you still get the alarm — you just get a worse explanation. Safe failure, as always.
Supervised self-healing
When a detected fault matches a curated template, the control plane proposes a fix.
You approve it; the control plane signs an Ed25519 command; the agent pulls it, the
privileged actuator runs it, and the result is recorded at-most-once. Here’s the
Remediations page after a few cycles — nothing pending, a clean history of
failed-unit-restart actions that each went approved → succeeded (active):
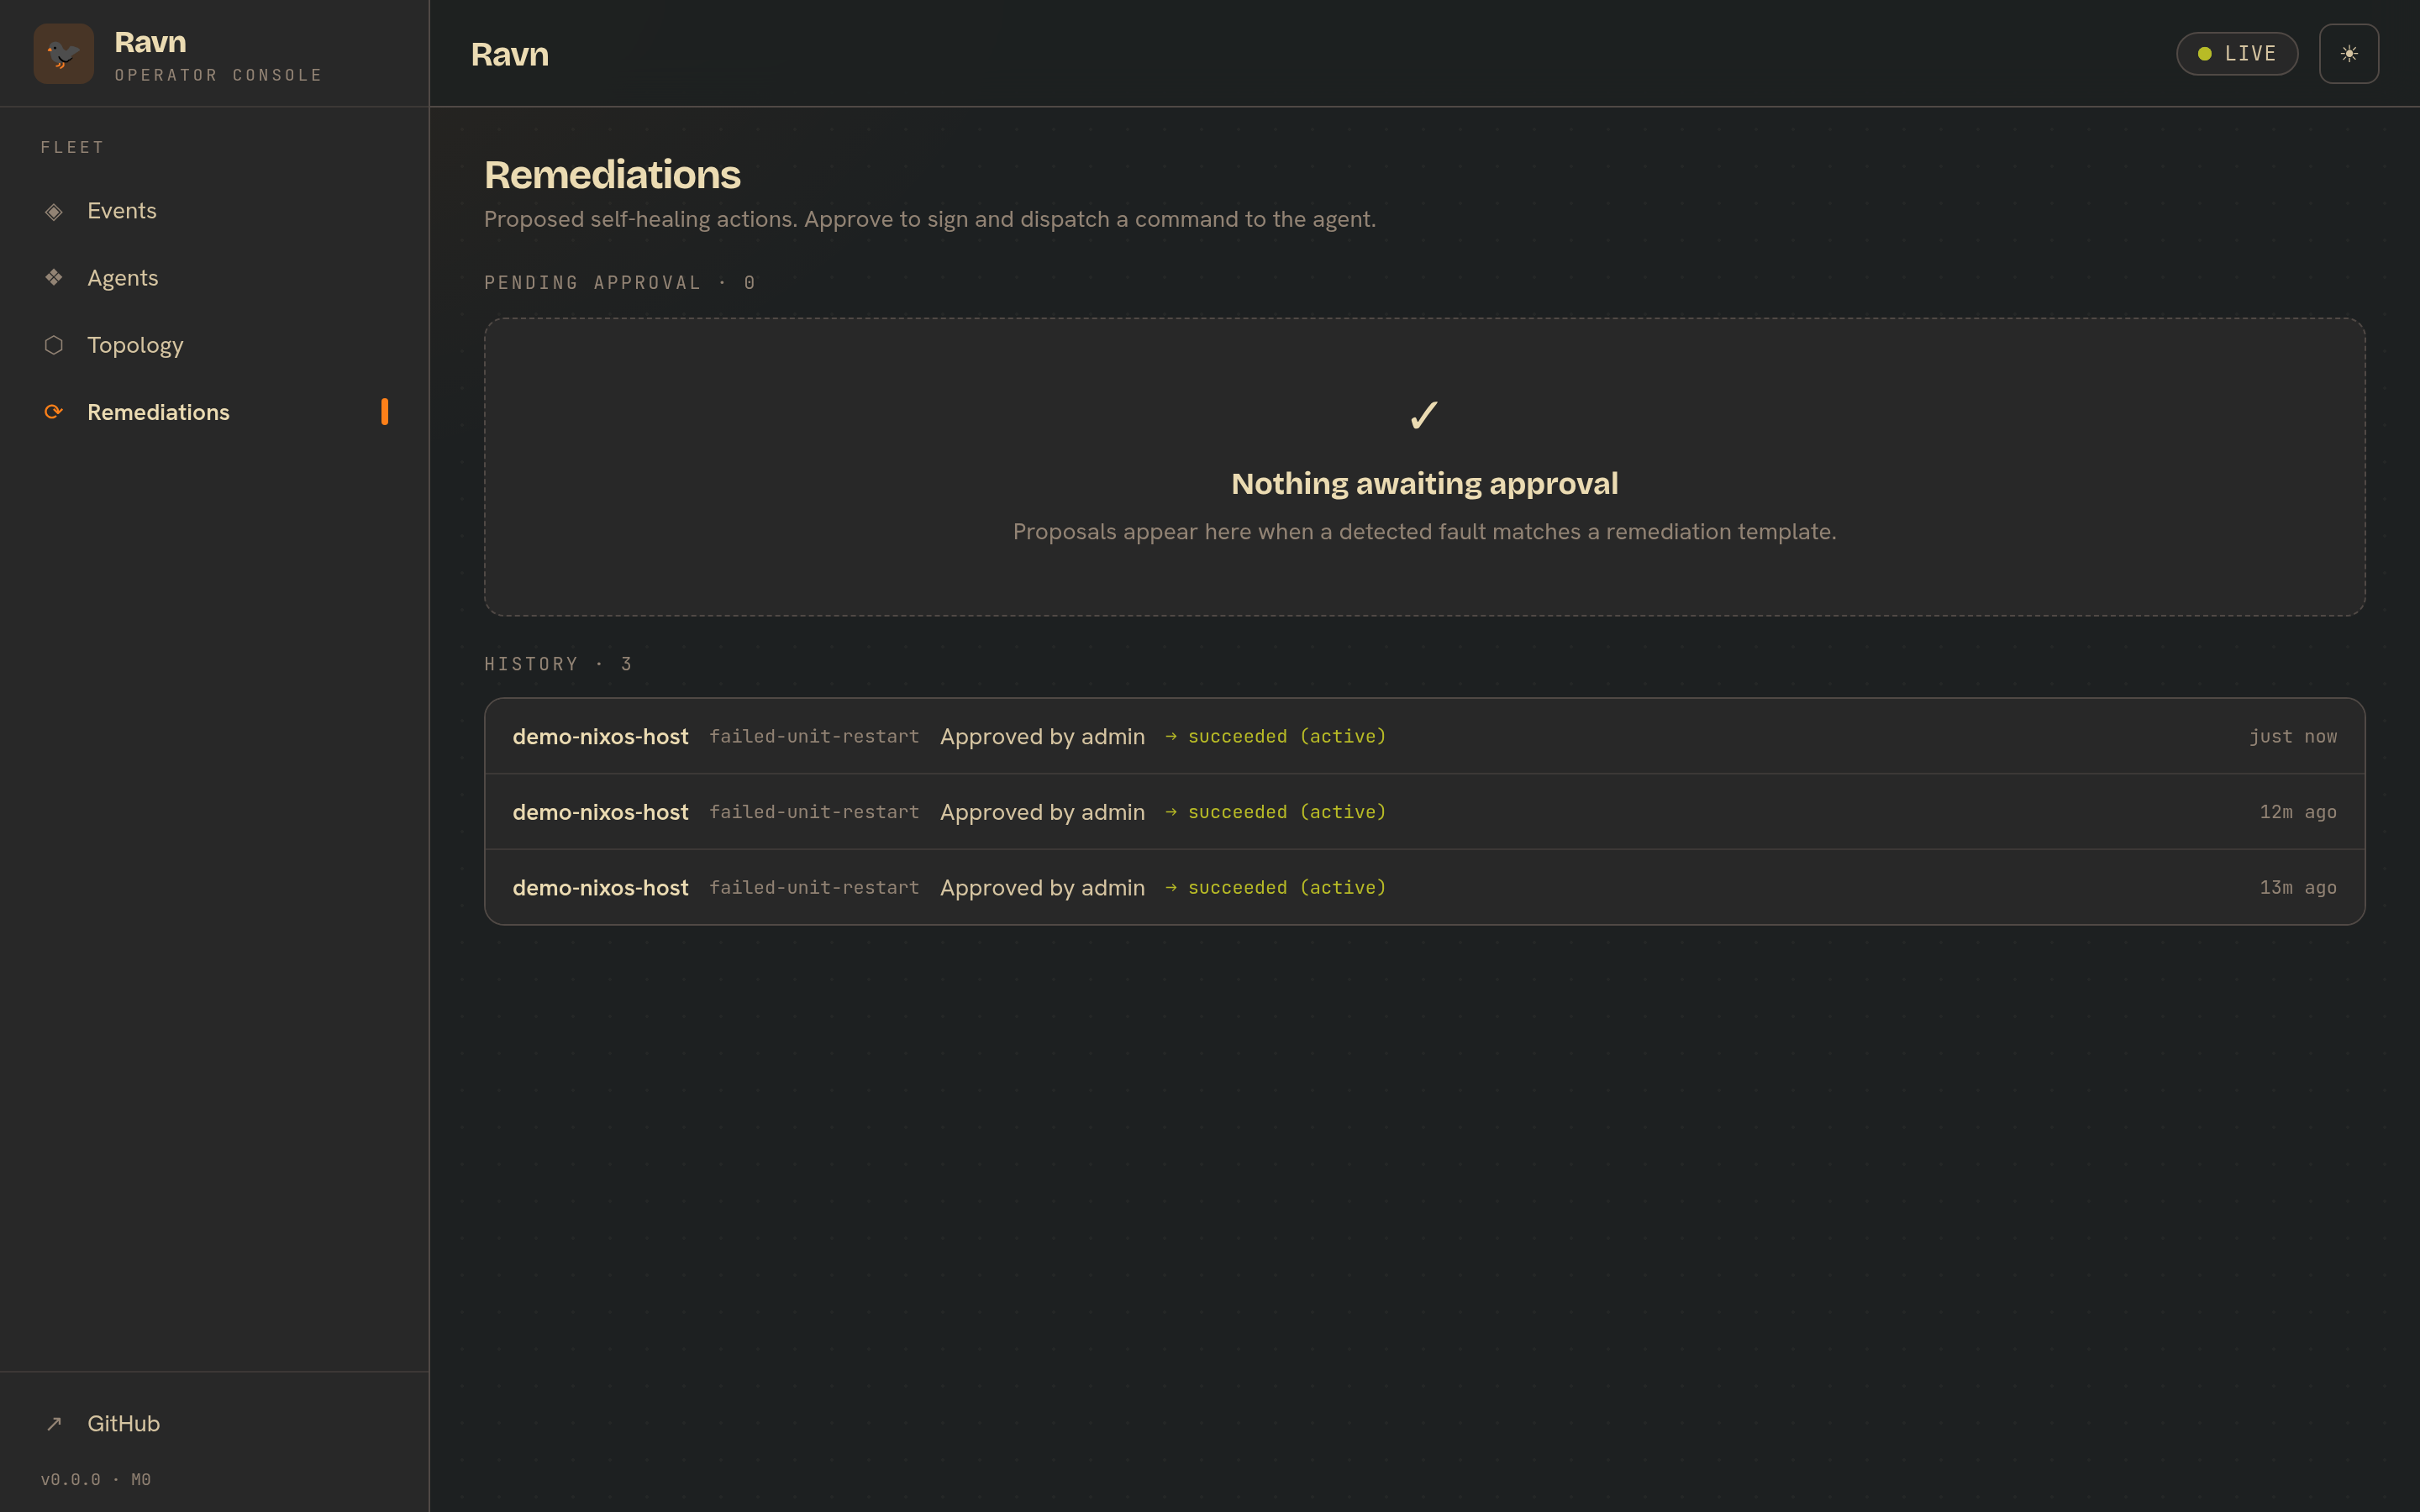
The whole loop — kill a unit, watch the proposal appear, approve, watch it come back — runs in a few seconds.
The problems we hit (the useful part)
Almost none of these were in the “product.” They were in making a distributed system pretend to be one laptop.
- The overlay footgun. A bare
docker compose upsilently dropped the demo overlay, which disabled remediation templates — so the agent detected the fault, proposed nothing, and everything looked fine. Fix:demo-up.shalways passes every overlay, and the README warns in bold. - Ollama on
127.0.0.1. No container — control plane, host agent, or k3d — could reach a host Ollama bound to loopback. That’s why explanations never appeared at first. Fix: a self-contained Ollama sidecar on the shared network; nothing on your host required. - CPU contention starved the explanations. On CPU, one inference stream
couldn’t keep up with the deliberately chatty demo, and the most useful event —
the failed unit — kept timing out. Putting Ollama on the AMD GPU via ROCm
(a 7900 XT,
ollama ps→100% GPU) took it to instant and 100% coverage. The demo auto-detects ROCm / NVIDIA / CPU; the README documents all three plus other GPUs and reusing an external Ollama. - A kernel-trace flood. Because the host container and the k3d cluster share
the laptop’s kernel, the cluster’s OOM stack-traces landed in the host’s
journald and buried the real service events. New
RAVN_JOURNALD_SKIP_KERNELoption drops raw kernel ring-buffer noise. (On real, separate hosts this never arises.) - Duplicate topology nodes. Every agent restart minted a fresh ID, leaving
offline ghosts in the topology. Fix: a stable
RAVN_AGENT_ID(the host agent’s counterpart to the controller’s fixed ID), so redeploys reuse the same node and keep their labels. - nginx OOMing on a big box. The “healthy” baseline pods crashlooped because nginx spins up one worker per core — dozens on a Threadripper — and blew past a small memory limit. Capped the workers; baseline is green again.
Try it
scripts/demo-up.sh                 # control plane + host + k3d + Ollama (auto GPU)
scripts/demo-remediate.sh --auto   # fail a unit, approve the fix, watch it heal
Then open the portal at http://localhost:8088/topology. Full instructions,
including GPU setup for AMD/NVIDIA/CPU, are in
demo/README.md.
As always: the model never decides whether something is wrong. It just tells you, in plain words, what already got flagged — and now it does it fast, on a GPU, while the fleet heals itself in front of you.
Comments are powered by Giscus (GitHub Discussions). They go live once Discussions is enabled, the Giscus app is installed, and
repo_id/category_idare set in_config.yml.